3D Scanning / Point Cloud / Digital Twin / AI
From space
to value.
We don't stop at the scan.
What you can do with point cloud data starts here.
Scroll to Explore
Above ground and below.
All of it, as data.
We scan the site in a short window without shutting down operations, and record it as millimeter-accurate point cloud data. Building on our track record in GNSS-denied sewer pipelines, we can also handle complex, difficult sites that call for an integrated above-ground and underground survey.
More on Capture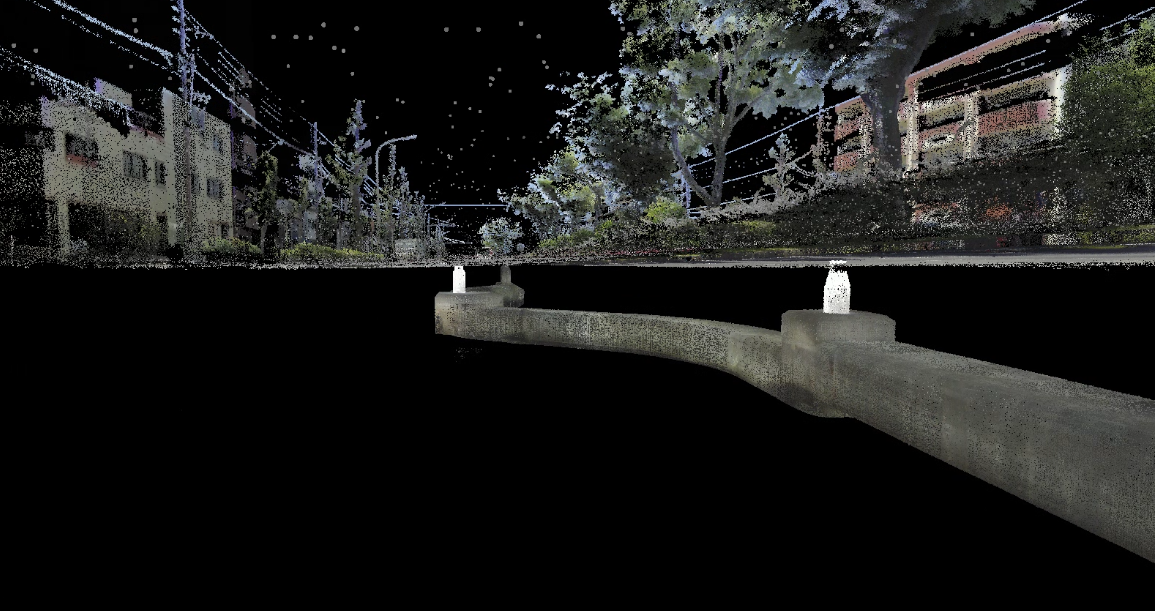
Large point clouds,
shared through one URL.
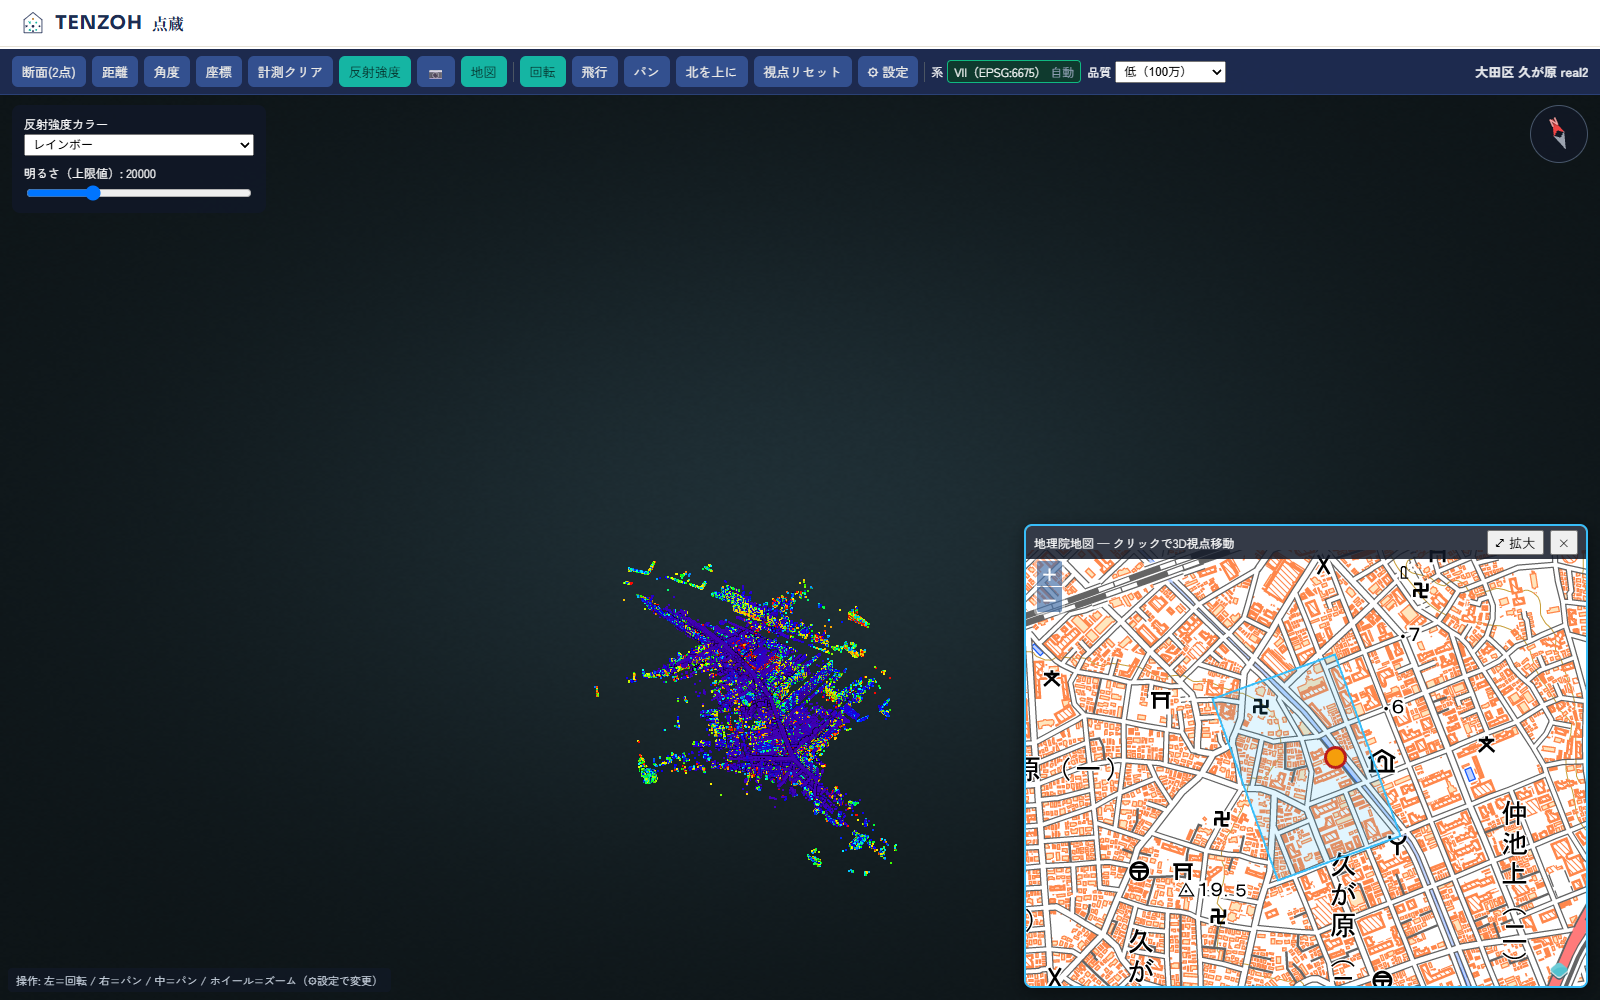
TENZOH, our point cloud viewer, lets you view, measure, and share in a browser. Nothing to install. GIS integration ties the data to locations on a map.
More on Share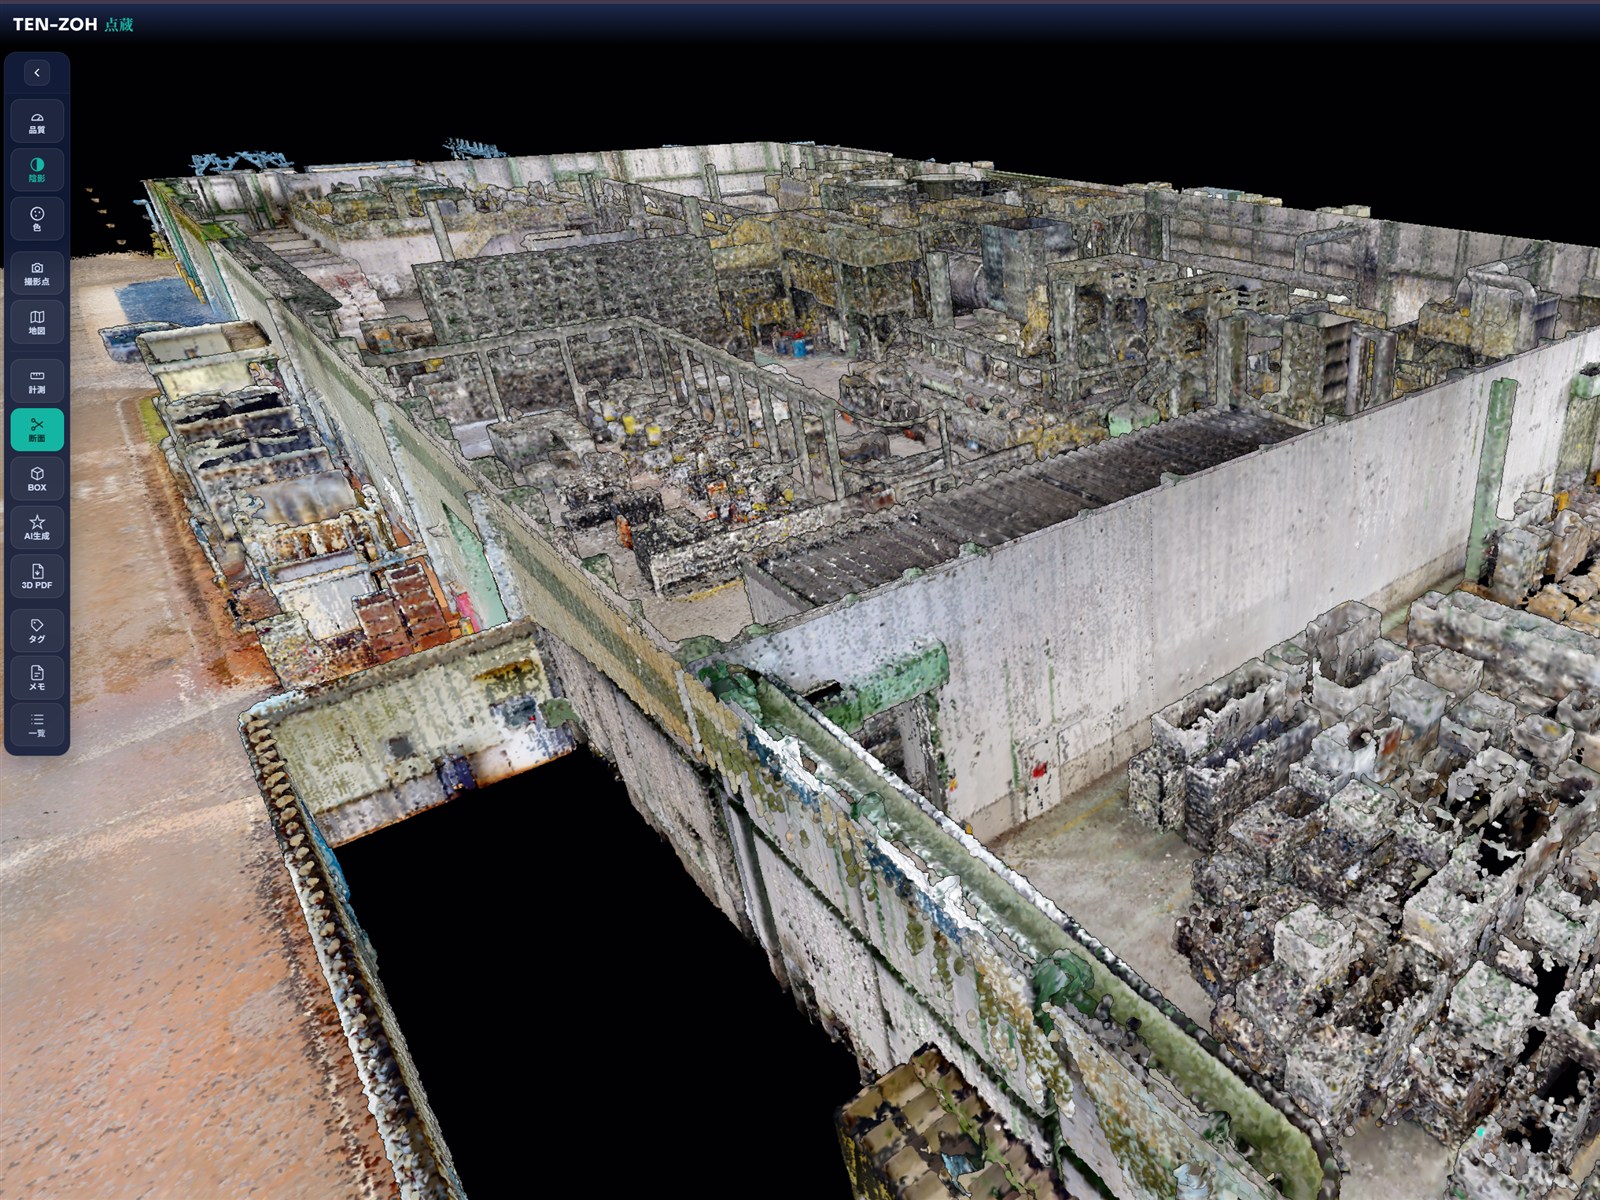
The same data,
in the format the job needs.
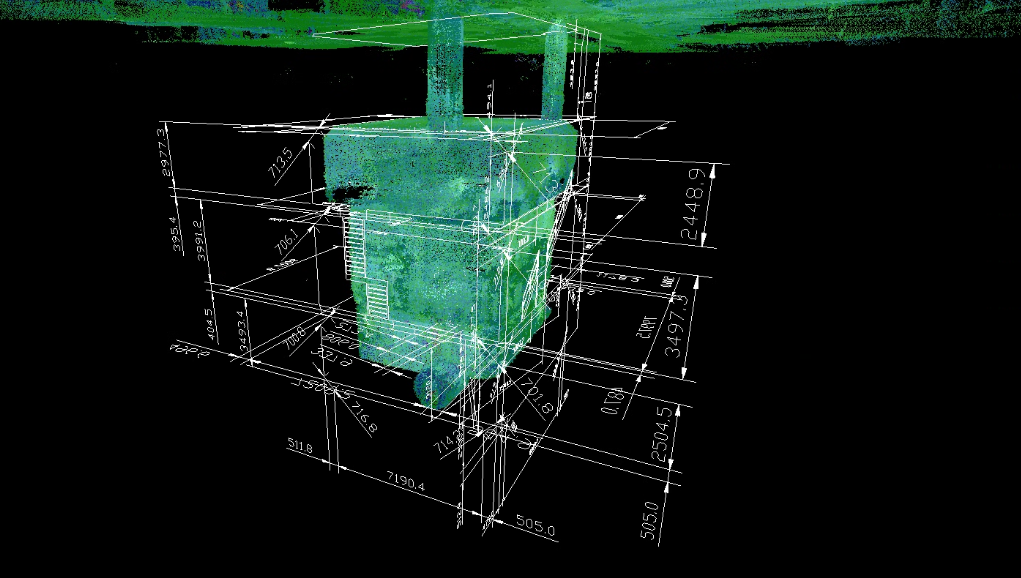
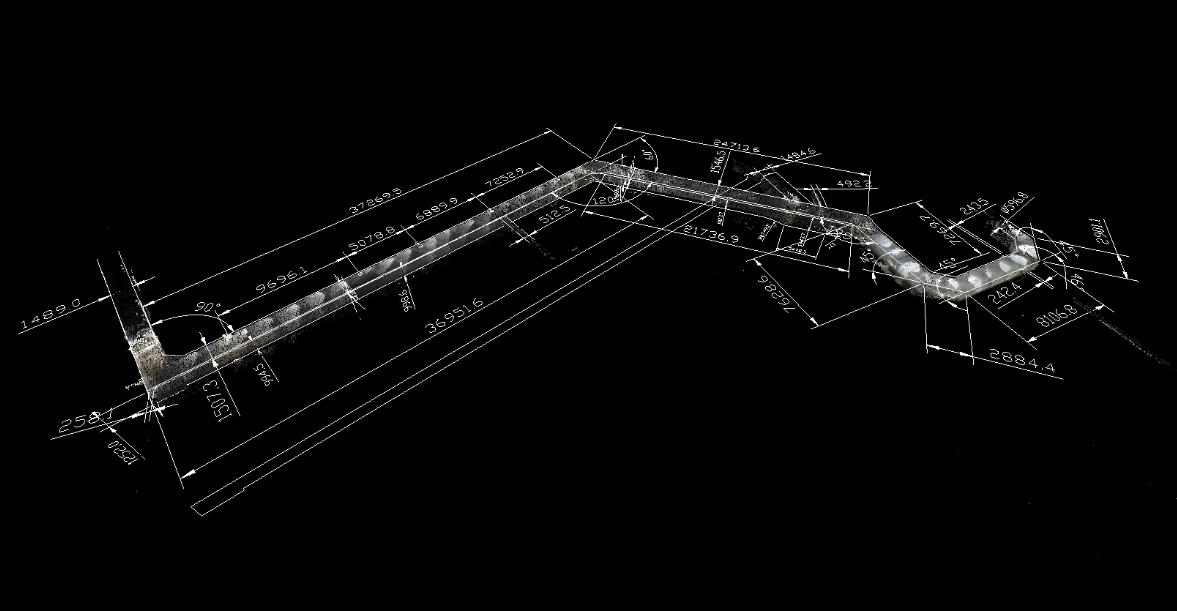
2D drawings for retrofit design, 3D models for simulation, and 3D PDFs for sharing inside the company. Your colleagues open them in Adobe Acrobat Reader—no CAD license needed. We deliver it in the format the job needs.
More on Convert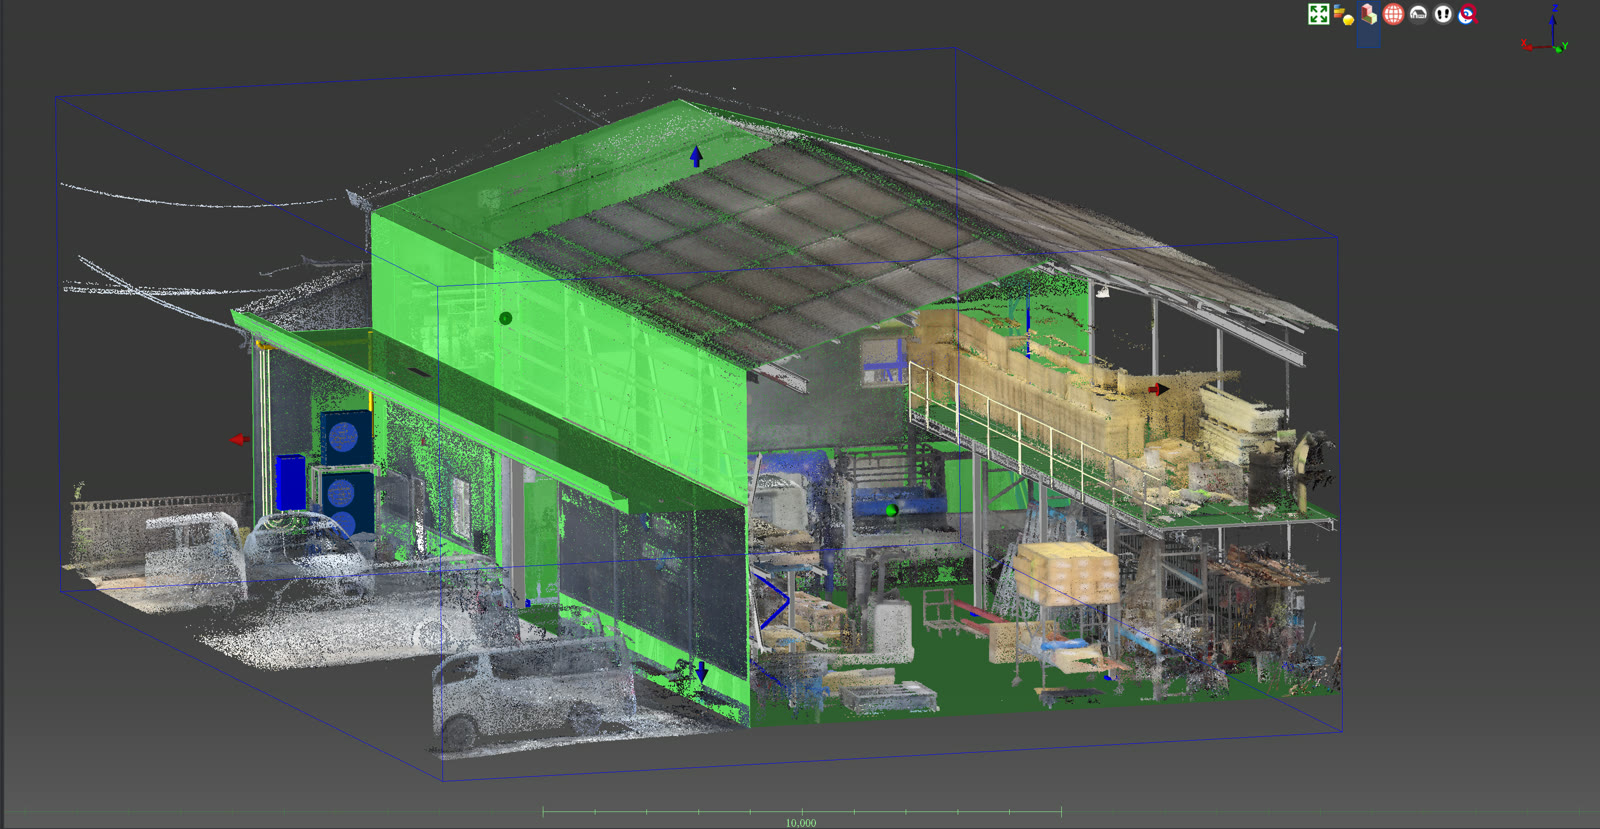
Changes and anomalies,
found in the data.
Change detection compares point clouds captured at two different times and puts a number on changes the eye would miss. AI screening narrows the area down to the locations that need a closer look.
More on Analyze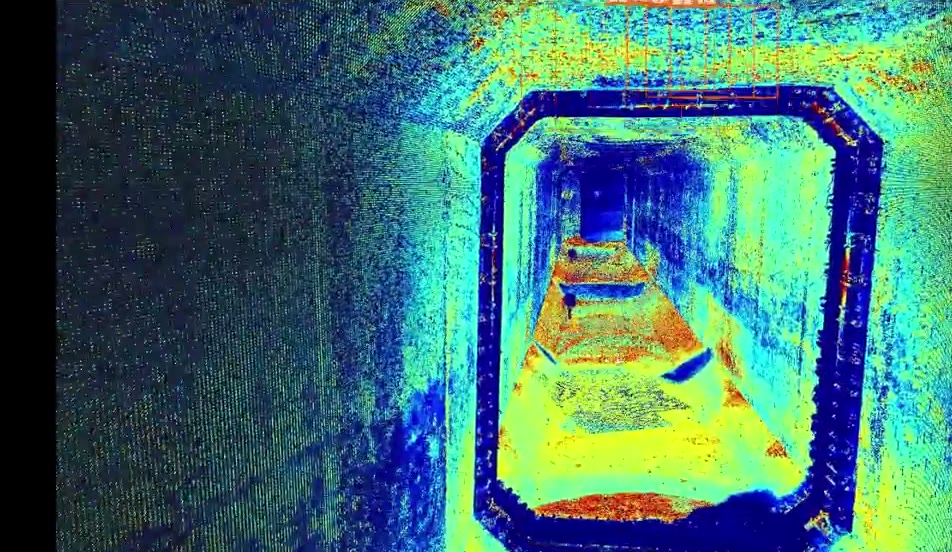
Your data,
built into how the work runs.
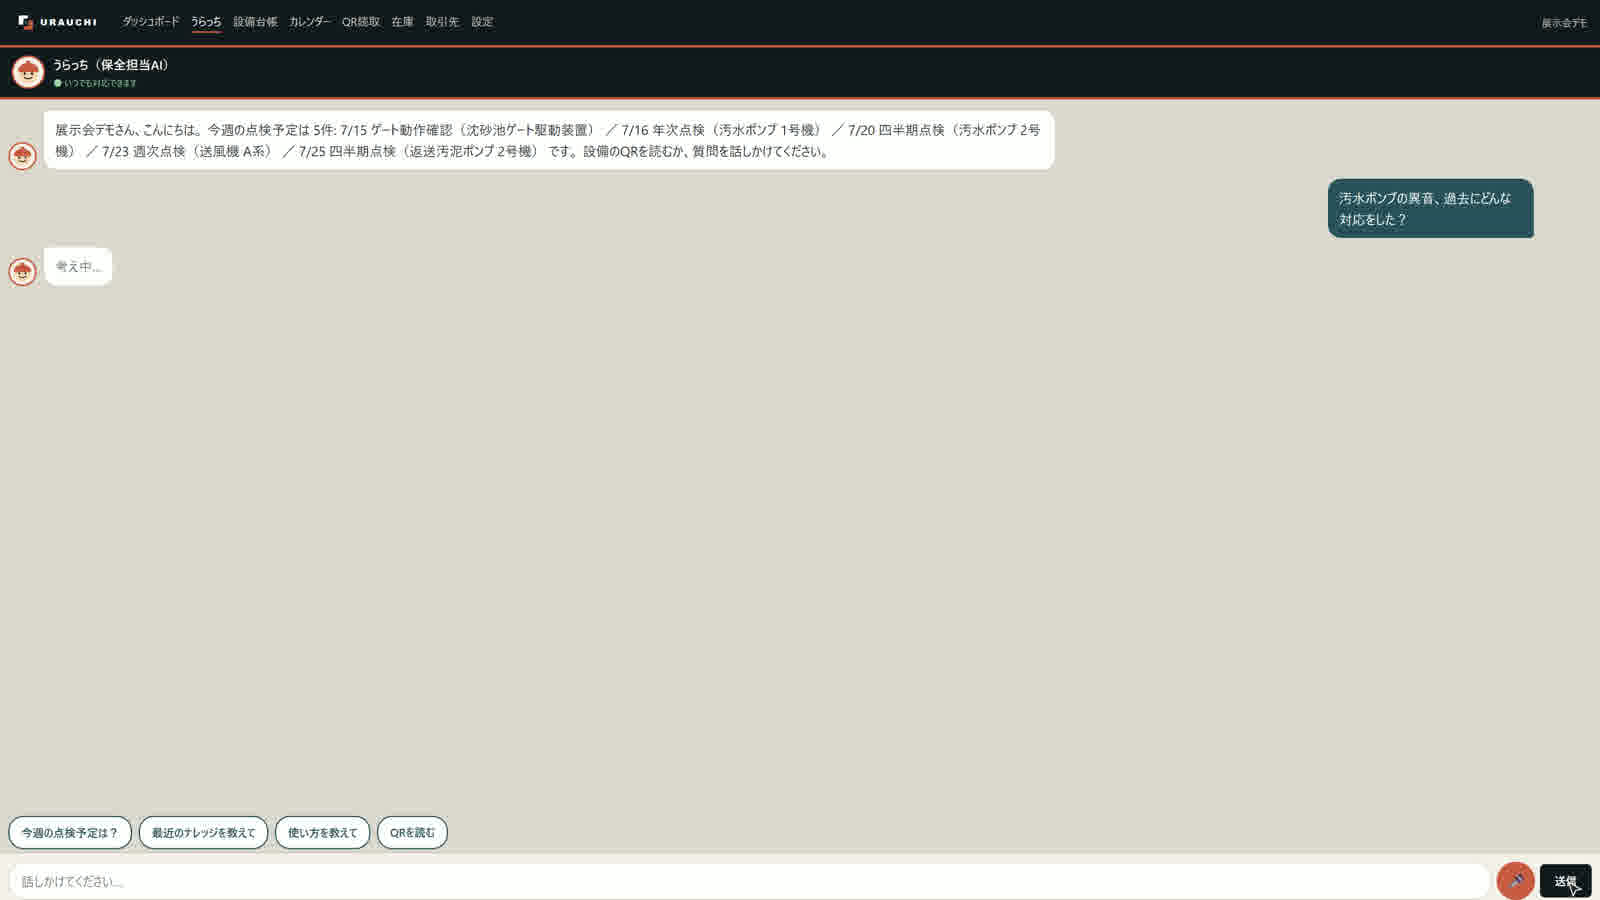
URAUCHI, a 3D-linked knowledge base, backs up field decisions with history. We also handle custom software development, including CAD drawing generation and AI quote drafting.
More on Build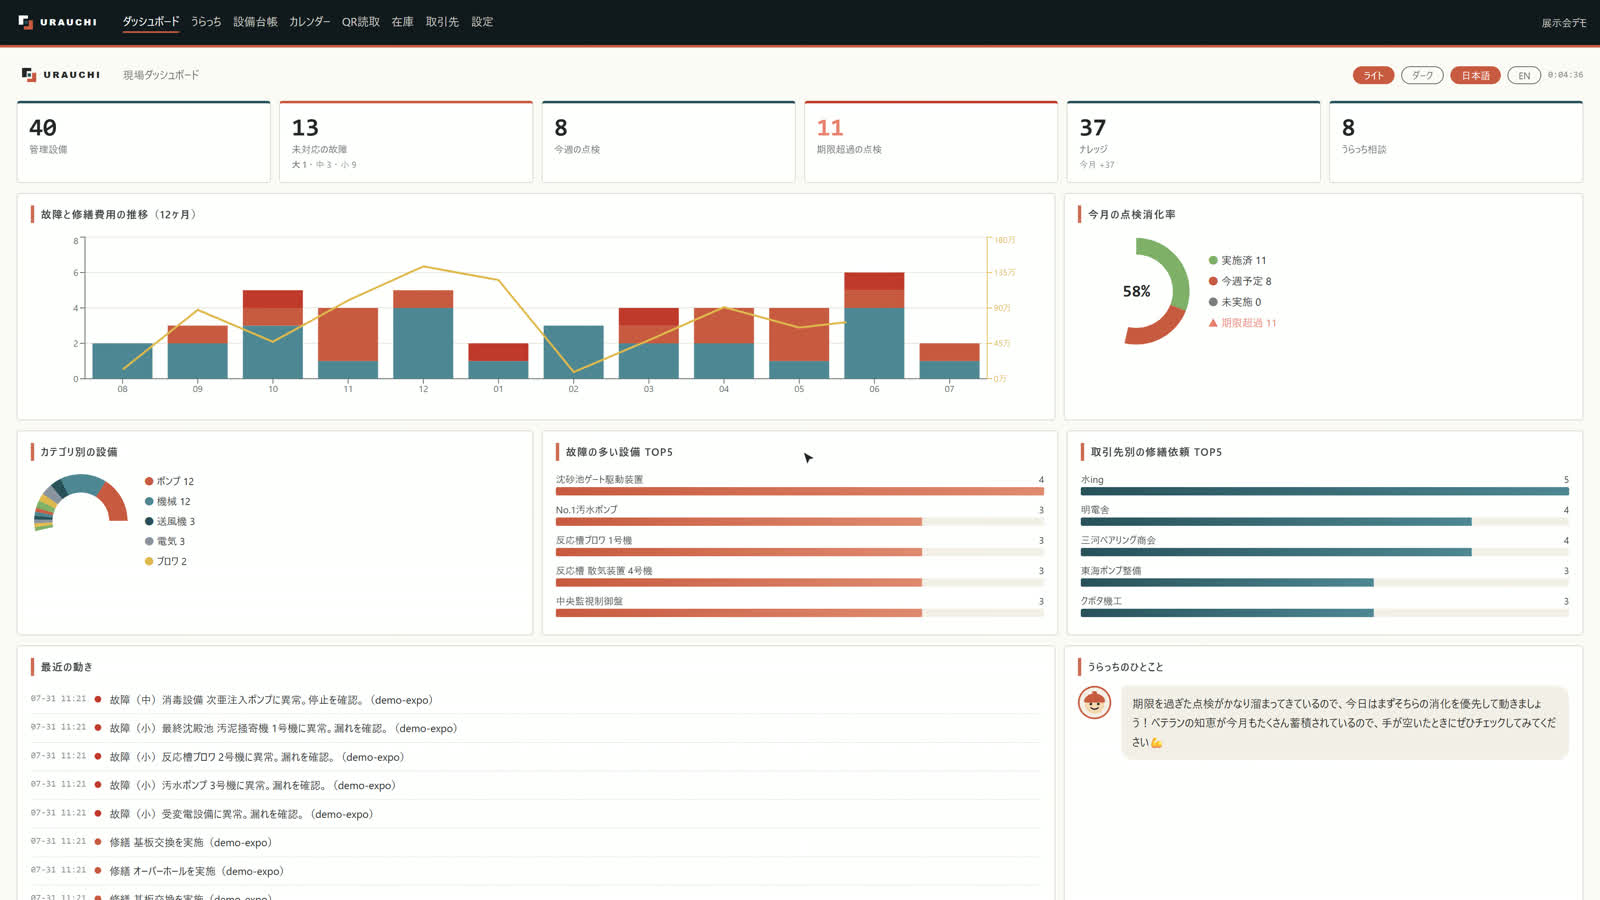
We've spent our careers on sites like yours.
Talk to us.
Contact us →
More than 20 km of sewer pipelines scanned · Over 1,000,000 m² total area scanned · Available nationwide in Japan · As of August 2026
Sources: FARO case study, published on faro.com · Gekkan Gesuido (Monthly Sewerage), March 2026 issue
Recmill Inc. | 4-54 Nohagi-cho, Moriyama-ku, Nagoya, Aichi 463-0042, Japan | Tel +81-50-1808-5531